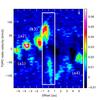
Fig. 12
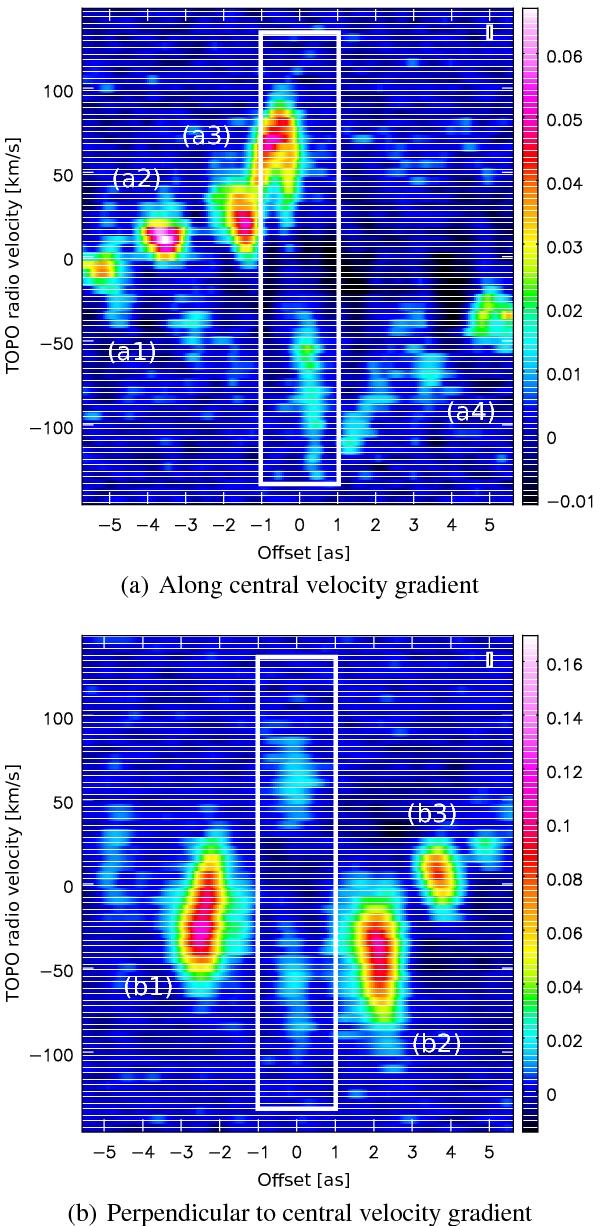
PV diagrams from the 12CO(3−2) ALMA cube a) along the central velocity gradient (PA = 140°) and b) perpendicular to the central velocity gradient (PA = 50°). The color-bar shows the flux density in [Jy beam-1]. The position of the cuts is displayed in Fig. 4c. The white rectangle marks the nuclear region in which the central velocity gradient is dominant. (a1) to (b3) mark dust arm positions: (a1) eastern arm, (a2) southern arm, (a3) nuclear arm, (a4) northern arm, (b1) overlap between eastern and southern arm, (b2) nuclear arm, (b3) southern arm (west).
Current usage metrics show cumulative count of Article Views (full-text article views including HTML views, PDF and ePub downloads, according to the available data) and Abstracts Views on Vision4Press platform.
Data correspond to usage on the plateform after 2015. The current usage metrics is available 48-96 hours after online publication and is updated daily on week days.
Initial download of the metrics may take a while.