Fig. 7
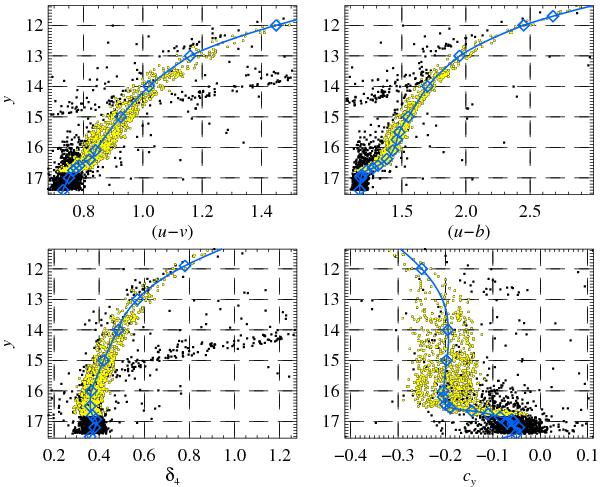
CMDs in (u − v) (upper left), (u − b) (upper right), δ4 (lower left), and cy (lower right). The solid (blue) lines represent the fiducial sequences from which distances (residuals) are used in the cluster analysis. Blue diamonds indicate points between which the sequence has been interpolated. Yellow squares represent the selected stars for the cluster analysis.
Current usage metrics show cumulative count of Article Views (full-text article views including HTML views, PDF and ePub downloads, according to the available data) and Abstracts Views on Vision4Press platform.
Data correspond to usage on the plateform after 2015. The current usage metrics is available 48-96 hours after online publication and is updated daily on week days.
Initial download of the metrics may take a while.