Fig. 3
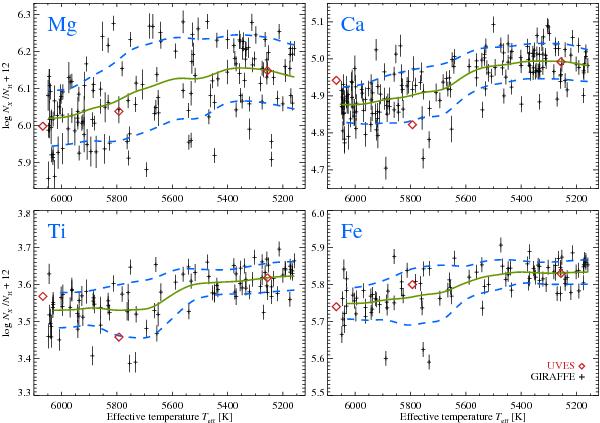
Evolutionary abundance trends of Mg, Ca, Ti, and Fe. Mg and Ca abundances are derived from neutral lines while Ti and Fe are derived from singly ionised lines (see Table 6). The solid (green) line represents the running mean (weighted average), while dashed (blue) lines represent the standard deviation. Error bars represent statistical errors. Systematic errors are indicated in Fig. 10. Overplotted in diamonds are the UVES results from Paper I, which have been vertically shifted for easier comparison.
Current usage metrics show cumulative count of Article Views (full-text article views including HTML views, PDF and ePub downloads, according to the available data) and Abstracts Views on Vision4Press platform.
Data correspond to usage on the plateform after 2015. The current usage metrics is available 48-96 hours after online publication and is updated daily on week days.
Initial download of the metrics may take a while.