Fig. 10
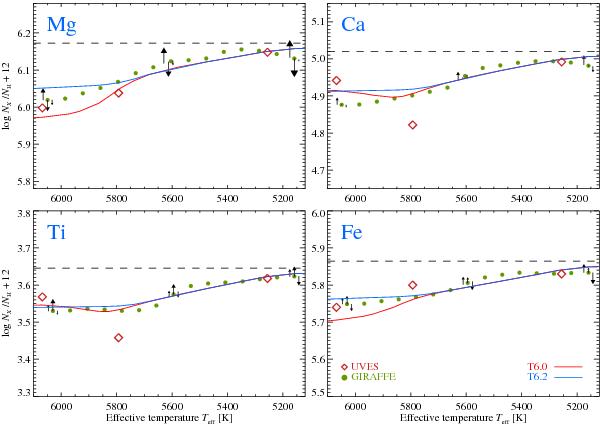
Averaged abundance trends from Fig. 3 (green bullets), compared to the predictions from stellar structure models including atomic diffusion with additional mixing with two different efficiencies, at an age of 13.5 Gyr. Horizontal, dashed lines represent the initial abundances of the models, which have been adjusted so that predictions match the observed abundance level of the coolest stars. The groups of three arrows in each panel indicate the influence on averaged abundances from increasing the effective temperature by 40 K (left), surface gravity by 0.1 dex (middle) and microturbulence by 0.1 km s-1 (right) – see also Table 5.
Current usage metrics show cumulative count of Article Views (full-text article views including HTML views, PDF and ePub downloads, according to the available data) and Abstracts Views on Vision4Press platform.
Data correspond to usage on the plateform after 2015. The current usage metrics is available 48-96 hours after online publication and is updated daily on week days.
Initial download of the metrics may take a while.