Fig. 5

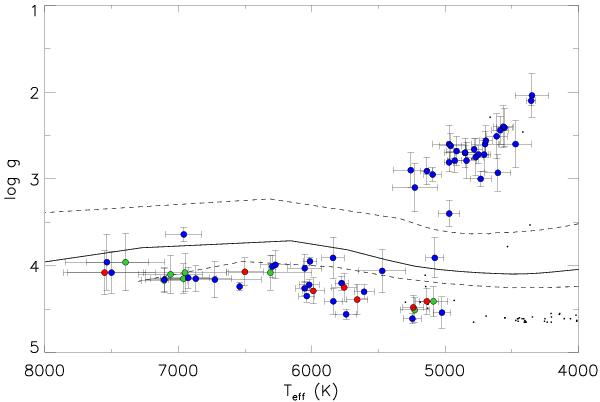
Surface gravity versus effective temperature. The diagram allows us to identify the giant field stars in the UVES sample as the objects that lie above the 5 Myr isochrone (solid line) together with the 1 and 10 Myr (dashed lines) isochrones using Siess et al. (2000) models. The different colors indicate RV members (red), RV nonmembers (blue), and stars excluded from the RV analysis (green). The black dots show the Giraffe members identified by Jeffries et al. (2014). Note that a few Giraffe Li members have gravity values below the 10 Myr isochrone. The diagram is limited to the temperature range relevant for the UVES targets.
Current usage metrics show cumulative count of Article Views (full-text article views including HTML views, PDF and ePub downloads, according to the available data) and Abstracts Views on Vision4Press platform.
Data correspond to usage on the plateform after 2015. The current usage metrics is available 48-96 hours after online publication and is updated daily on week days.
Initial download of the metrics may take a while.


