Fig. 3
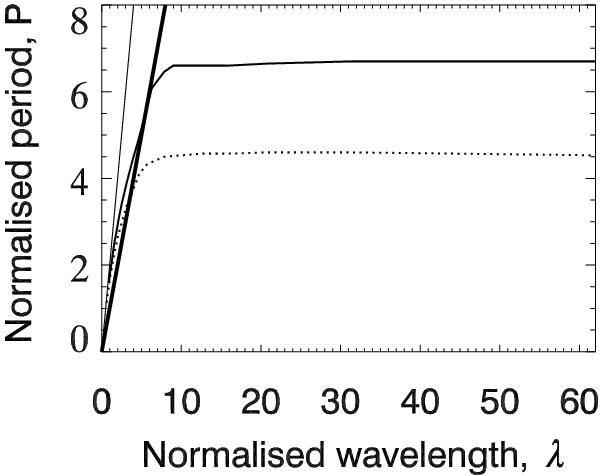
Comparison of the variation of period of these oscillations against longitudinal wavelength in the slab and cylindrical cases, both curves have values of α = 6 and δ = 0.5, the dotted line represents the cylindrical case (Nakariakov et al. 2012), the solid line represents the slab. The thick straight line shows P = λ/CA∞, that is the cutoff separating the trapped and leaky regimes. The thinner straight line shows P = λ/CA0 which corresponds to the short wavelength asymptote.
Current usage metrics show cumulative count of Article Views (full-text article views including HTML views, PDF and ePub downloads, according to the available data) and Abstracts Views on Vision4Press platform.
Data correspond to usage on the plateform after 2015. The current usage metrics is available 48-96 hours after online publication and is updated daily on week days.
Initial download of the metrics may take a while.