Fig. 2
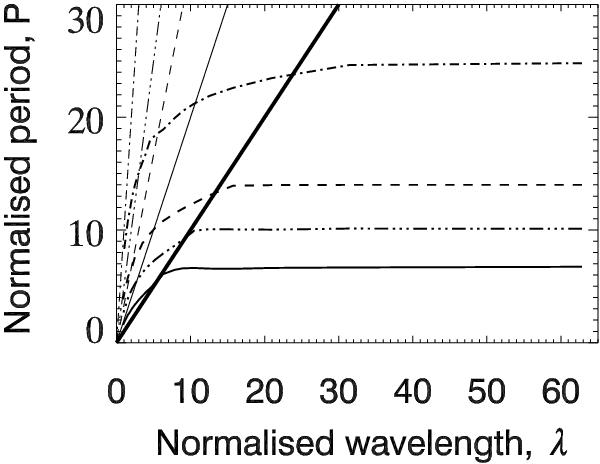
Variation of the sausage oscillation period with the wavelength in a plasma slab with α = 6, for different values of δ: the solid line corresponds to δ = 0.5, the triple dot-dashed line corresponds to δ = 0.7, the dashed line to δ = 0.8, and the dot-dashed line to δ = 0.9. The thick straight line shows P = λ/CAe, that is the cutoff separating the trapped and leaky regimes. The thinner straight lines show P = λ/CA0 that correspond to the short wavelength asymptote in each case.
Current usage metrics show cumulative count of Article Views (full-text article views including HTML views, PDF and ePub downloads, according to the available data) and Abstracts Views on Vision4Press platform.
Data correspond to usage on the plateform after 2015. The current usage metrics is available 48-96 hours after online publication and is updated daily on week days.
Initial download of the metrics may take a while.