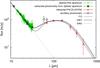
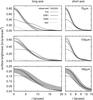
Fig. 2

Observed SED and radial profiles plotted along with the simulated data from the FG, SW1, and SW2 models in Table 2. For a detailed description of the observational data see Ertel et al. (2014). Note that data points with a signal-to-noise ratio <3 are excluded from the available Spitzer/IRS spectrum. In the radial profile plots, the gray-shaded areas depict the observed data with 1σ uncertainties at PACS wavelengths (from top to bottom: 70, 100, and 160μm). Cuts along the long and short axes are given in the left and right column, respectively.
Current usage metrics show cumulative count of Article Views (full-text article views including HTML views, PDF and ePub downloads, according to the available data) and Abstracts Views on Vision4Press platform.
Data correspond to usage on the plateform after 2015. The current usage metrics is available 48-96 hours after online publication and is updated daily on week days.
Initial download of the metrics may take a while.