Fig. 6
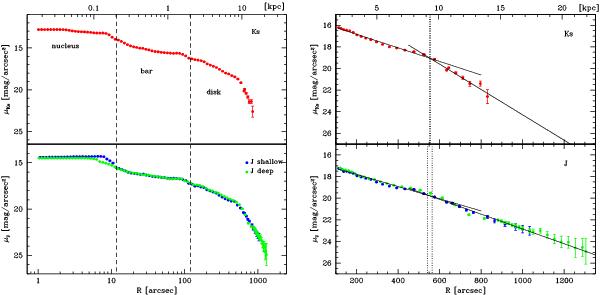
Left panel: azimuthally averaged surface brightness profiles as function of log(R), with R being the isophote major axis from ELLIPSE. Data are for the shallow images in the J (blue dots) and Ks-band (red dots) as well as the deep data in J-band (green dots). The dashed lines delimit the regions where the main components of the galaxy structure are located. Right panel: enlargement of the azimuthally averaged surface brightness profiles on the disk region in J (bottom) and Ks (top) bands, as a function of the semi-major axis R. The vertical dotted lines indicate the range of radii of the break; the straight lines are the best fit using an exponential law (see text for details).
Current usage metrics show cumulative count of Article Views (full-text article views including HTML views, PDF and ePub downloads, according to the available data) and Abstracts Views on Vision4Press platform.
Data correspond to usage on the plateform after 2015. The current usage metrics is available 48-96 hours after online publication and is updated daily on week days.
Initial download of the metrics may take a while.