Fig. 3
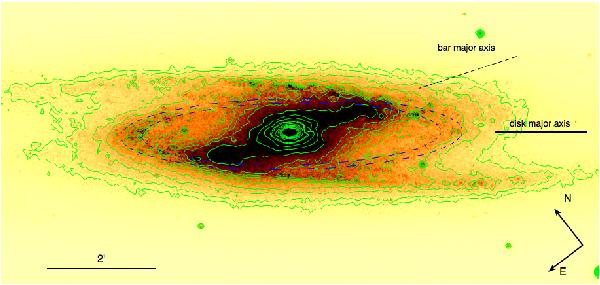
Central 11 × 5 arcmin region of the Ks band VISTA image of NGC 253. The green lines are the isophote contours (the outer and inner contour levels correspond to a surface brightness of μKs = 17.6 mag arcsec-2 and μKs = 13.5 mag arcsec-2, respectively). On the right side of the image, the solid and dashed black lines indicate the directions of the disk and bar major axis respectively. The dashed blue annulus encircles the ring-like structure enclosing the bar.
Current usage metrics show cumulative count of Article Views (full-text article views including HTML views, PDF and ePub downloads, according to the available data) and Abstracts Views on Vision4Press platform.
Data correspond to usage on the plateform after 2015. The current usage metrics is available 48-96 hours after online publication and is updated daily on week days.
Initial download of the metrics may take a while.