Fig. 14
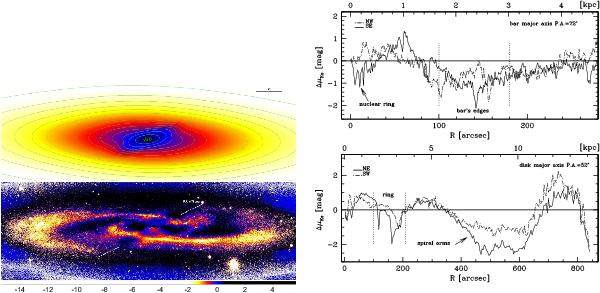
Top-left panel: galfit 2D model computed using two Sersic laws for bulge and bar, and a double exponential law for the disk. Bottom-left panel: residual image derived by subtracting the 2D model from the galaxy image, in a logarithmic scale. Right panels: differences between the observed and fitted light profiles along the disk major axis (bottom panel) and along the bar major axis (top panel). Δμ < 0 where the galaxy is brighter than the model.
Current usage metrics show cumulative count of Article Views (full-text article views including HTML views, PDF and ePub downloads, according to the available data) and Abstracts Views on Vision4Press platform.
Data correspond to usage on the plateform after 2015. The current usage metrics is available 48-96 hours after online publication and is updated daily on week days.
Initial download of the metrics may take a while.