Fig. 12
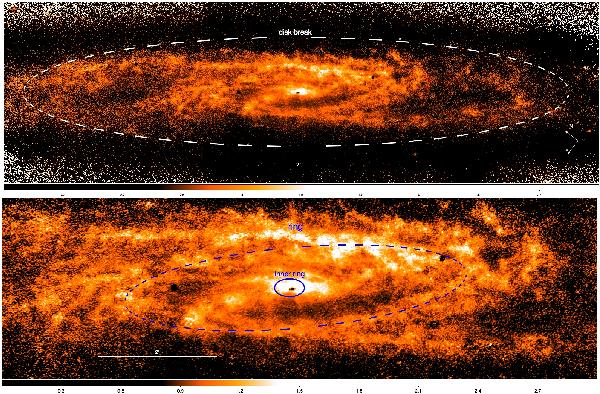
J − Ks color map of NGC 253 and an enlargement of the nuclear region (bottom panel). Lighter colors are redder J − Ks values. The isophote corresponding to the disk break (white dashed line) is overlaid on the image in the top panel. The blue ellipses overlaid on the enlarged image (bottom panel) indicate the regions where the nuclear ring (solid line) and the ring at the end of the bar (dashed line) reside.

Current usage metrics show cumulative count of Article Views (full-text article views including HTML views, PDF and ePub downloads, according to the available data) and Abstracts Views on Vision4Press platform.
Data correspond to usage on the plateform after 2015. The current usage metrics is available 48-96 hours after online publication and is updated daily on week days.
Initial download of the metrics may take a while.