Fig. 9
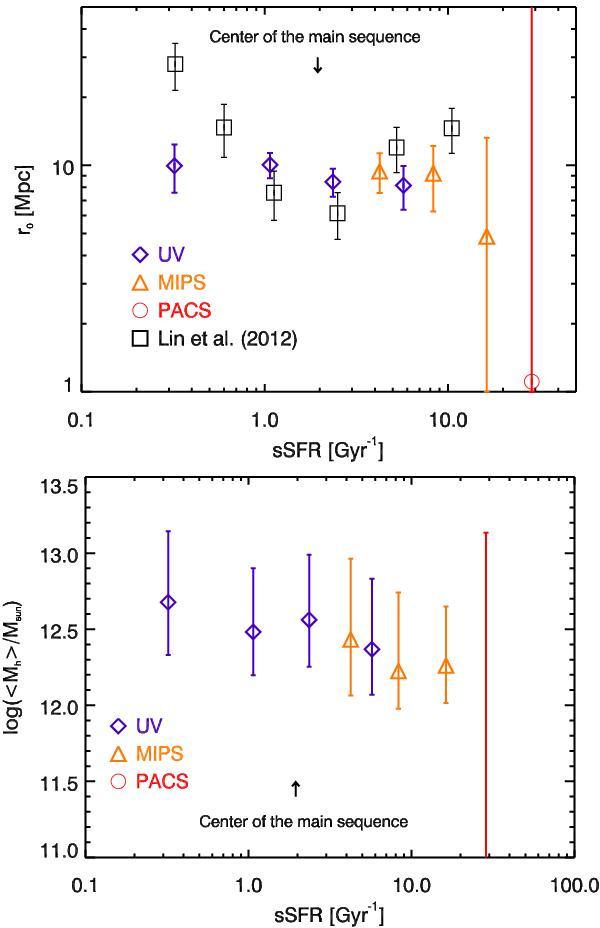
Upper panel: correlation length of our various subsamples of log (M⋆/M⊙) > 10.5 galaxies as a function of their sSFR measured at various wavelengths (purple for UV, orange for MIPS 24 μm, and red for PACS). For comparison, the data from Lin et al. (2012) are plotted with black squares. Lower panel: mean mass of halos, which host log (M⋆/M⊙) > 10.5 galaxies as a function of their sSFR.
Current usage metrics show cumulative count of Article Views (full-text article views including HTML views, PDF and ePub downloads, according to the available data) and Abstracts Views on Vision4Press platform.
Data correspond to usage on the plateform after 2015. The current usage metrics is available 48-96 hours after online publication and is updated daily on week days.
Initial download of the metrics may take a while.