Fig. 8
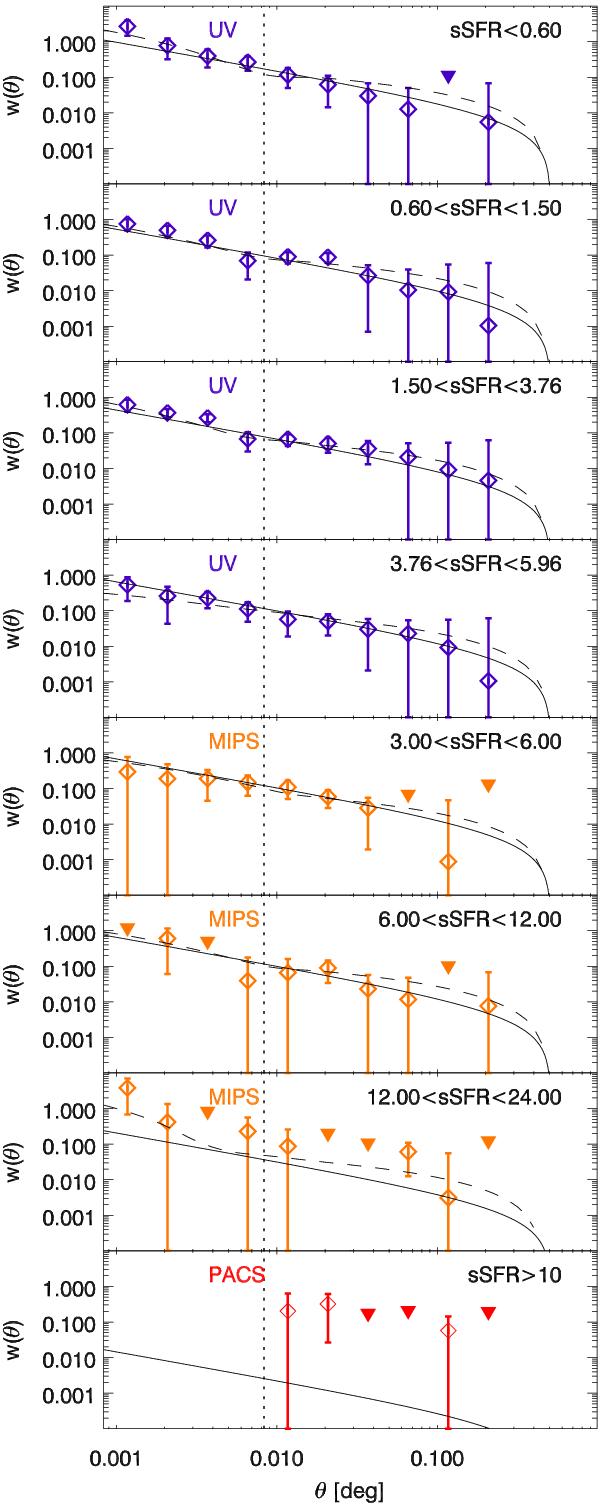
Autocorrelation function of our various subsamples as a function of their sSFR measured at various wavelengths (purple for UV, orange for MIPS 24 μm, and red for PACS). The solid line is the best fit for the power-law model (fitted only above the 30′′ limit represented by the vertical dotted line) and the dashed line the best-fit HOD model. The triangles represent the 3σ upper limits for data points with negative central values.
Current usage metrics show cumulative count of Article Views (full-text article views including HTML views, PDF and ePub downloads, according to the available data) and Abstracts Views on Vision4Press platform.
Data correspond to usage on the plateform after 2015. The current usage metrics is available 48-96 hours after online publication and is updated daily on week days.
Initial download of the metrics may take a while.