Fig. 7
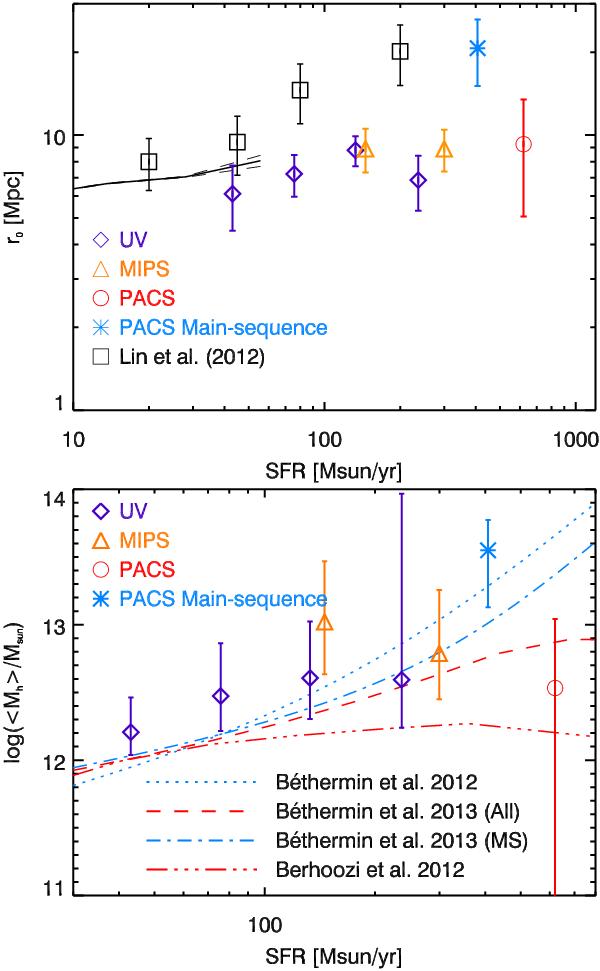
Upper panel: correlation length of our various subsamples as a function of their SFR measured at various wavelengths. For comparison, the data from Lin et al. (2012) are plotted with black squares. The predictions of the Lagos et al. (2011) model is represented with a black solid line, and the 1σ confidence region with a black dashed line. Lower panel: mean mass of halos that host galaxies as a function of their star formation rate. We overplotted the estimate performed by abundance matching for main-sequence galaxies of Béthermin et al. (2012b; dotted line), the predictions of the Béthermin et al. (2013) model for main-sequence (dot-dash line) and all (dashed line) galaxies, and the prediction for all galaxies of the Behroozi et al. (2013) model (three-dot-dash line).
Current usage metrics show cumulative count of Article Views (full-text article views including HTML views, PDF and ePub downloads, according to the available data) and Abstracts Views on Vision4Press platform.
Data correspond to usage on the plateform after 2015. The current usage metrics is available 48-96 hours after online publication and is updated daily on week days.
Initial download of the metrics may take a while.