Fig. 5
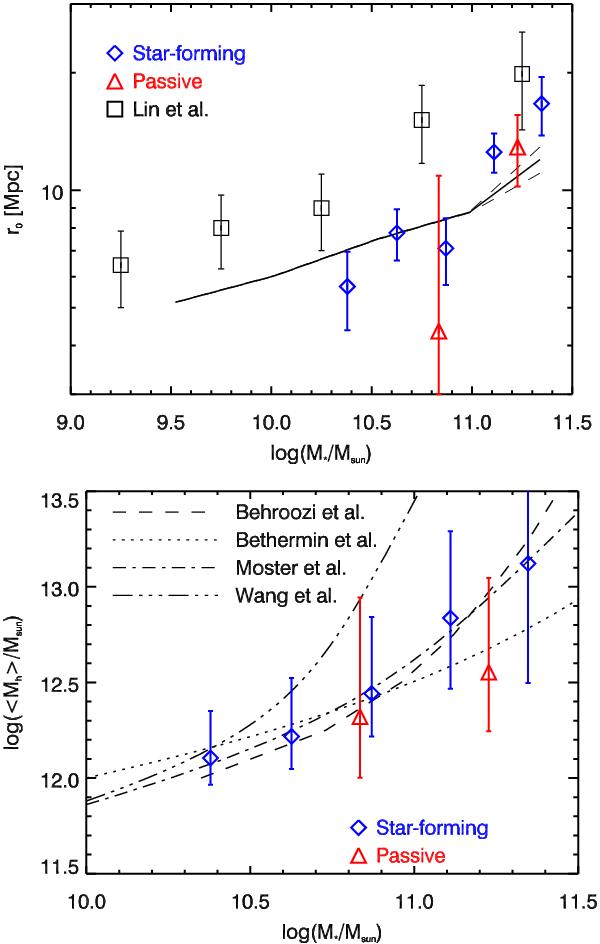
Upper panel: correlation length of star-forming (blue diamonds) and passive (red triangles) galaxies as a function of their stellar mass. For comparison, the data from Lin et al. (2012) are plotted as black squares. The predictions of the Lagos et al. (2011) model is represented with a black solid line, and the 1σ confidence region with black dashed line. Lower panel: mean mass of halos, which host star-forming (blue diamonds) and passive (red triangles) galaxies as a function of their mass. For comparison, we over-plotted the estimates performed by abundance matching by Behroozi et al. (2010; dashed line), Béthermin et al. (2012b; dotted line), Moster et al. (2010; dot-dash line), and Wang et al. (2013).
Current usage metrics show cumulative count of Article Views (full-text article views including HTML views, PDF and ePub downloads, according to the available data) and Abstracts Views on Vision4Press platform.
Data correspond to usage on the plateform after 2015. The current usage metrics is available 48-96 hours after online publication and is updated daily on week days.
Initial download of the metrics may take a while.