Fig. 3
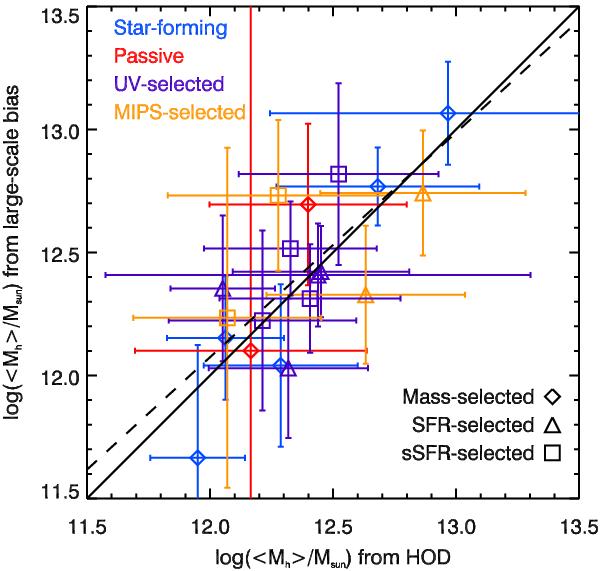
Comparison between the mean host-halo mass derived from the determination of the large-scale (>1′) bias (see Sect. 3.3.2) and from HOD modeling (see Sect. 3.3.2). The data points represent all the samples for which the HOD model can be applied, i.e., the non-PACS-selected ones. The solid line is the one-to-one relation and the dashed line the best, linear fit of the data.
Current usage metrics show cumulative count of Article Views (full-text article views including HTML views, PDF and ePub downloads, according to the available data) and Abstracts Views on Vision4Press platform.
Data correspond to usage on the plateform after 2015. The current usage metrics is available 48-96 hours after online publication and is updated daily on week days.
Initial download of the metrics may take a while.