Fig. 10
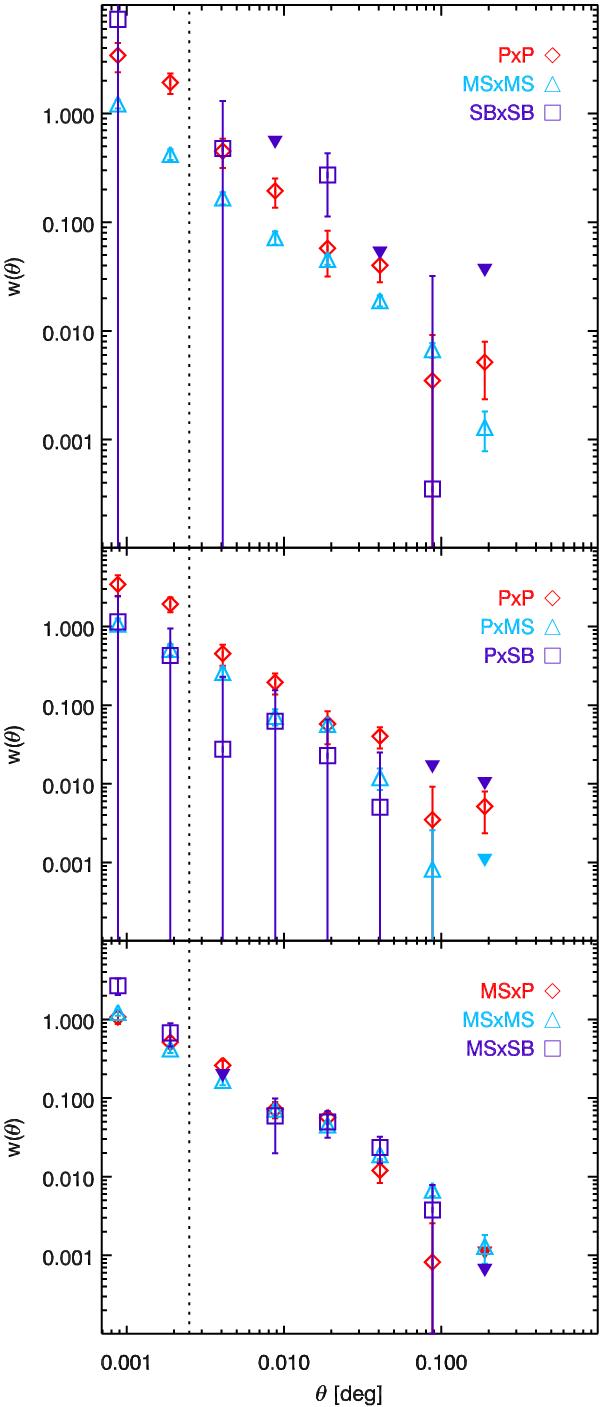
Upper panel: autocorrelation function of the passive (red diamonds), main-sequence (blue triangles), and starburst (purple squares) log (M⋆/M⊙) > 10.5 galaxies. Middle panel: autocorrelation of passive galaxies (red diamonds) compared with the cross-correlation between passive and main-sequence (blue triangles) or starburst (purple squares) galaxies. Lower panel: autocorrelation of main-sequence galaxies (blue triangles) compared with the cross-correlation between main-sequence and passive (red triangles) or starburst (purple squares) galaxies. The vertical dotted line indicates the size of the PACS PSF. Below this limit, the reliability of the starburst correlation function is not certain.
Current usage metrics show cumulative count of Article Views (full-text article views including HTML views, PDF and ePub downloads, according to the available data) and Abstracts Views on Vision4Press platform.
Data correspond to usage on the plateform after 2015. The current usage metrics is available 48-96 hours after online publication and is updated daily on week days.
Initial download of the metrics may take a while.