Fig. 1
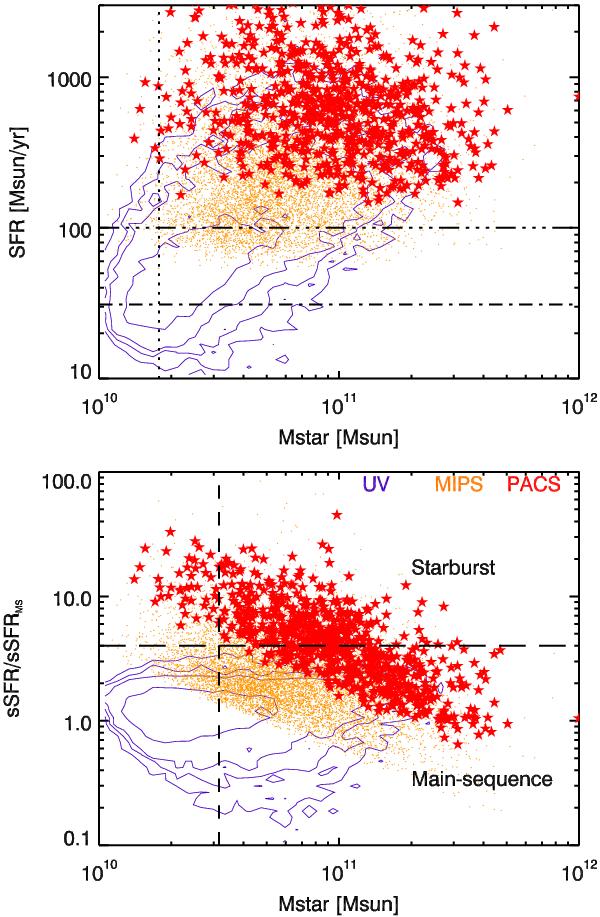
Upper panel: position of our sBzK sources in the SFR-M⋆ plane. The purple contours indicate sources with only UV-detection (i.e., having no mid/far-IR), the orange dots the MIPS-but-not-PACS-detected sources, and the red stars the PACS-detected sources. The vertical dotted line indicates the stellar mass where the sample becomes strongly incomplete. The horizontal dot-dash and three-dot-dash lines represents the completeness limits in SFR of the UV and MIPS subsamples. Lower panel: distance between our sBzK sources and the center of the main sequence. The horizontal long-dash line corresponds to the limit between the galaxies classified as main sequence of starburst. The vertical short-dash line shows the mass cut that defines a complete mass-selected sample of starburst galaxies detected by PACS.
Current usage metrics show cumulative count of Article Views (full-text article views including HTML views, PDF and ePub downloads, according to the available data) and Abstracts Views on Vision4Press platform.
Data correspond to usage on the plateform after 2015. The current usage metrics is available 48-96 hours after online publication and is updated daily on week days.
Initial download of the metrics may take a while.