Fig. 8
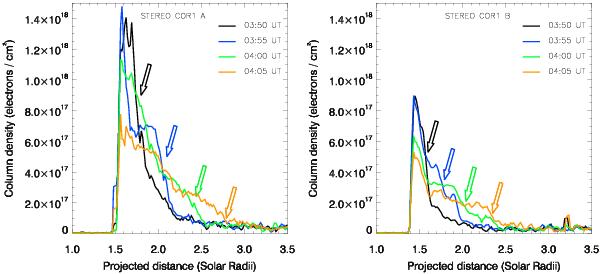
Plasma column density as a function of the distance projected on the plane of the sky along the paths 1, calculated from the COR1-A and -B calibrated images, taken from 3:50 UT to 4:05 UT with 5-min time cadence, and by setting an angular distance of the plasma from the POS of the two coronagraphs of θA = + 16° and θB = −24°, respectively. The arrows with the same colors as the profiles considered approximately indicate the CME front at different times.
Current usage metrics show cumulative count of Article Views (full-text article views including HTML views, PDF and ePub downloads, according to the available data) and Abstracts Views on Vision4Press platform.
Data correspond to usage on the plateform after 2015. The current usage metrics is available 48-96 hours after online publication and is updated daily on week days.
Initial download of the metrics may take a while.