Free Access
Fig. 3
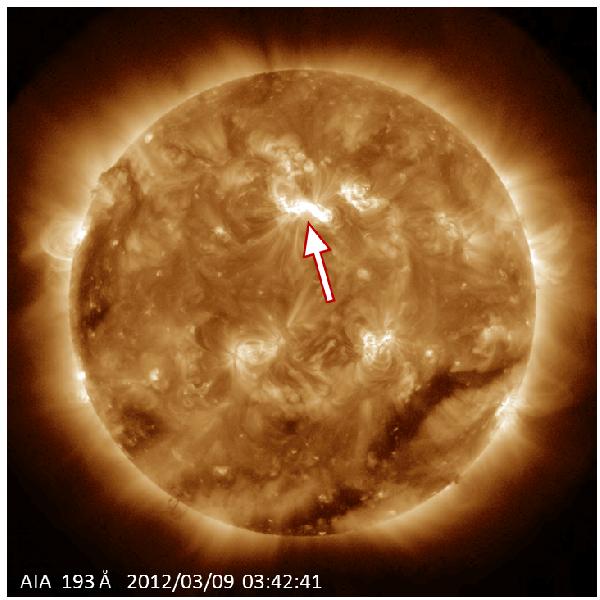
SDO/AIA 193 Å image at 3:42 UT on 9 March 2012. The arrow points out active region NOAA 11429. An animation showing the coronal wave by running difference images is available online.
Current usage metrics show cumulative count of Article Views (full-text article views including HTML views, PDF and ePub downloads, according to the available data) and Abstracts Views on Vision4Press platform.
Data correspond to usage on the plateform after 2015. The current usage metrics is available 48-96 hours after online publication and is updated daily on week days.
Initial download of the metrics may take a while.