Free Access
Fig. 2
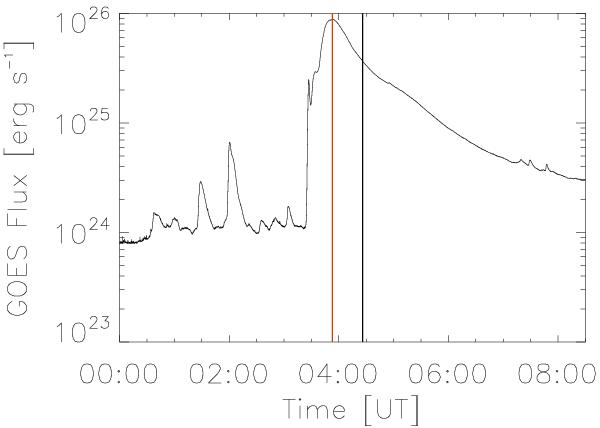
GOES X-ray (1–8 Å) emission from 0:00 UT to 8:00 UT on 9 March 2012. The flare onset (~3:25 UT) corresponds to the rapid flux increase. The red vertical line indicates the time of the peak of the flare (3:53 UT), while the black vertical line coincides with the beginning of the LASCO/C2 observation of the CME (4:26 UT).
Current usage metrics show cumulative count of Article Views (full-text article views including HTML views, PDF and ePub downloads, according to the available data) and Abstracts Views on Vision4Press platform.
Data correspond to usage on the plateform after 2015. The current usage metrics is available 48-96 hours after online publication and is updated daily on week days.
Initial download of the metrics may take a while.