Fig. 13
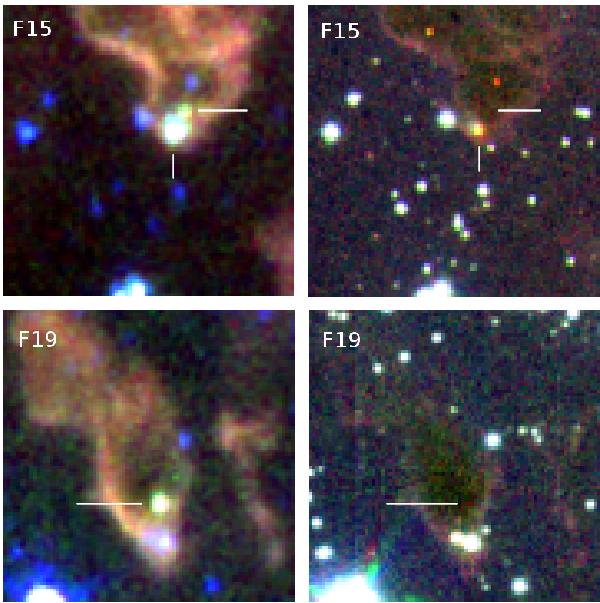
False-color images of the eastern jaw of the Claw (upper panels) and of globulette RN 129 (lower panels). The lines indicate the locations of YSOs. Left: IRAC bands 8.0, 5.8, and 3.6 μm coded in red, green, and blue, respectively. Right: SOFI Ks, H , and J images coded in red, green, and blue, respectively. All images are 53′′ × 53′′.
Current usage metrics show cumulative count of Article Views (full-text article views including HTML views, PDF and ePub downloads, according to the available data) and Abstracts Views on Vision4Press platform.
Data correspond to usage on the plateform after 2015. The current usage metrics is available 48-96 hours after online publication and is updated daily on week days.
Initial download of the metrics may take a while.