Free Access
Fig. 12
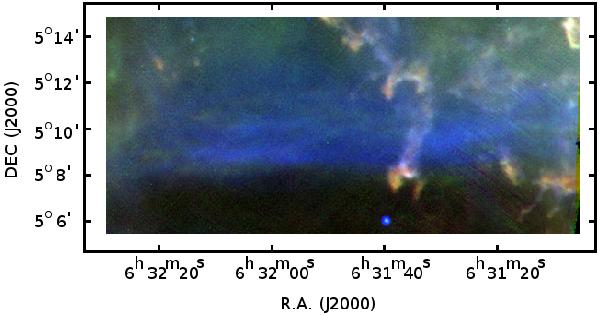
Color−coded MIPS and PACS image covering the SOFI fields except F7. PACS 160 μm, 70 μm, and MIPS 24 μm are coded in red, green, and blue, respectively. The largest globulettes in F19 can be seen in the upper left corner.
Current usage metrics show cumulative count of Article Views (full-text article views including HTML views, PDF and ePub downloads, according to the available data) and Abstracts Views on Vision4Press platform.
Data correspond to usage on the plateform after 2015. The current usage metrics is available 48-96 hours after online publication and is updated daily on week days.
Initial download of the metrics may take a while.