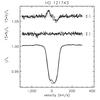
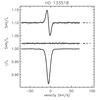
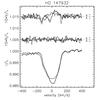
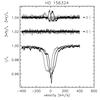
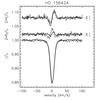
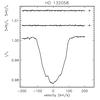
Fig. 2
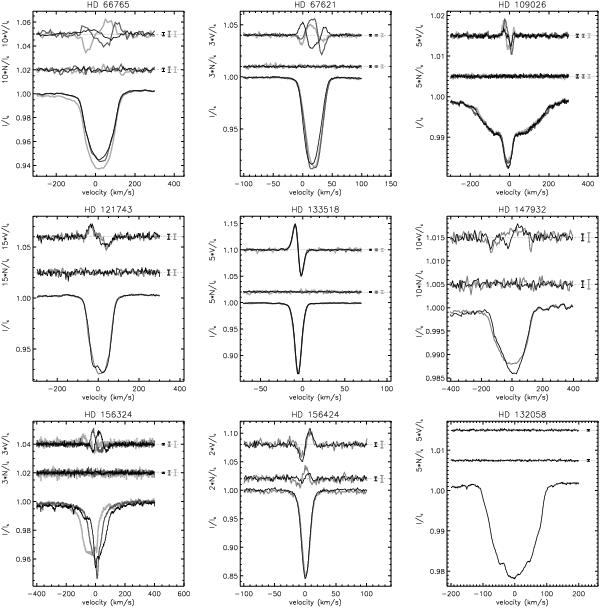
LSD I (bottom), V (top) and N (middle) profiles of the stars of our sample. For comparison, the profiles of a star with no detected field, HD 132058, are also plotted. The V and N profiles have been shifted and multiplied by a magnification factor for display purpose. The mean error bars in V and N are plotted on the side of each profile. HD 66765: the observations obtained at phases 0.06 (black), 0.43 (light grey) and 0.81 (dark grey) are plotted. HD 67621: the observations obtained at phases 0.11 (dark grey), 0.37 (light grey) and 0.73 (black) are plotted. HD 109026: the observations obtained at phases 0.42 (black), 0.71 (light grey) and 0.95 (dark grey) are plotted. For all other stars, the profiles have been plotted in order of decreasing darkness for decreasing V S/N. The three observations of HD 133518 are almost perfectly superimposed.
Current usage metrics show cumulative count of Article Views (full-text article views including HTML views, PDF and ePub downloads, according to the available data) and Abstracts Views on Vision4Press platform.
Data correspond to usage on the plateform after 2015. The current usage metrics is available 48-96 hours after online publication and is updated daily on week days.
Initial download of the metrics may take a while.