Fig. 4
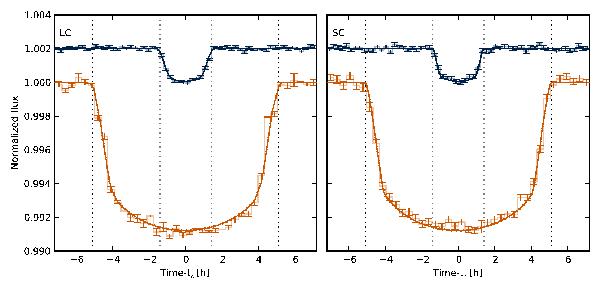
Phase-folded and binned Kepler transit light curves showing Kepler-418b (below) and KOI-1089.02 (top). The solid lines represent the best-fit model and the dotted lines the first and last contact points for the transits. The 68th percentile limits of the model predictive distributions are also shown, but fall within the line width. The left-hand panel shows the results fort the long-cadence data while the right-hand panel shows those for the short-cadence data.
Current usage metrics show cumulative count of Article Views (full-text article views including HTML views, PDF and ePub downloads, according to the available data) and Abstracts Views on Vision4Press platform.
Data correspond to usage on the plateform after 2015. The current usage metrics is available 48-96 hours after online publication and is updated daily on week days.
Initial download of the metrics may take a while.