Fig. 1
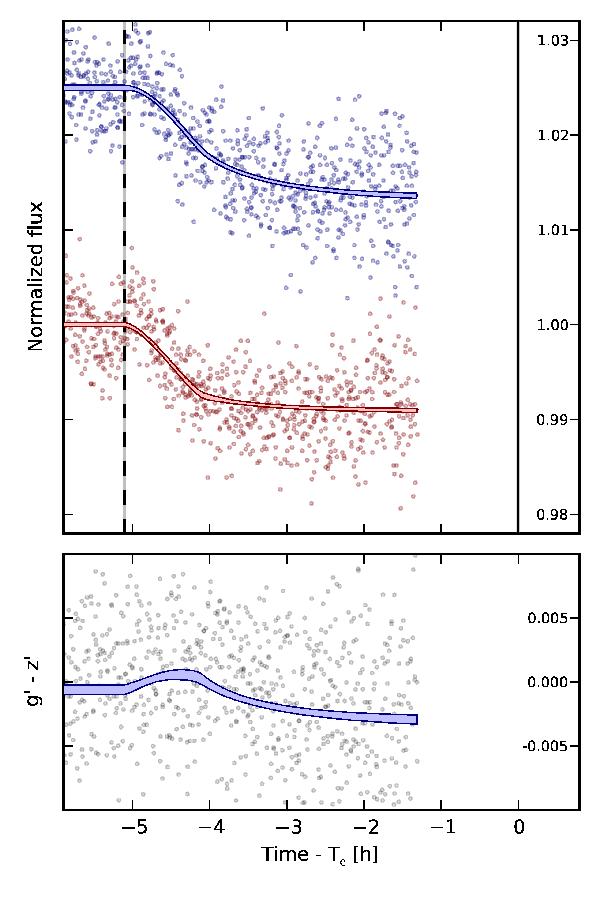
Kepler-418b transit observed by the GTC in Sloan g′ and z′ filters. Upper panel: observed light curves and the 95% confidence limits for the transit models, lower panel: color differences for the observed and modeled data in units of normalized flux, with the zero-point fitted to the off-transit data. The dashed vertical line represents the expected beginning of the transit, and the solid black line shows the fitted transit center. The 95% confidence limits for each value are depicted as gray shaded ares, but these fall inside the line widths.
Current usage metrics show cumulative count of Article Views (full-text article views including HTML views, PDF and ePub downloads, according to the available data) and Abstracts Views on Vision4Press platform.
Data correspond to usage on the plateform after 2015. The current usage metrics is available 48-96 hours after online publication and is updated daily on week days.
Initial download of the metrics may take a while.