Fig. 3
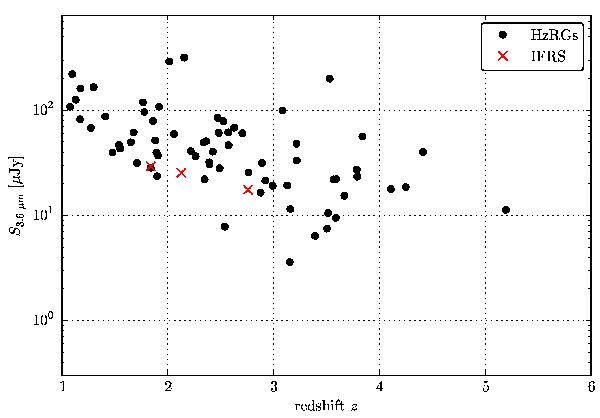
3.6 μm IR flux density versus redshift, adapted from Norris et al. (2011). Shown is the sample of HzRGs from Seymour et al. (2007) as black dots and the three IFRS whose redshifts are presented in this work as red crosses. The IFRS are located in the same parameter range as the HzRGs and seem to follow their S3.6 μm − z relation. It appears that IFRS define the lower bound of HzRGs.
Current usage metrics show cumulative count of Article Views (full-text article views including HTML views, PDF and ePub downloads, according to the available data) and Abstracts Views on Vision4Press platform.
Data correspond to usage on the plateform after 2015. The current usage metrics is available 48-96 hours after online publication and is updated daily on week days.
Initial download of the metrics may take a while.