Fig. 2
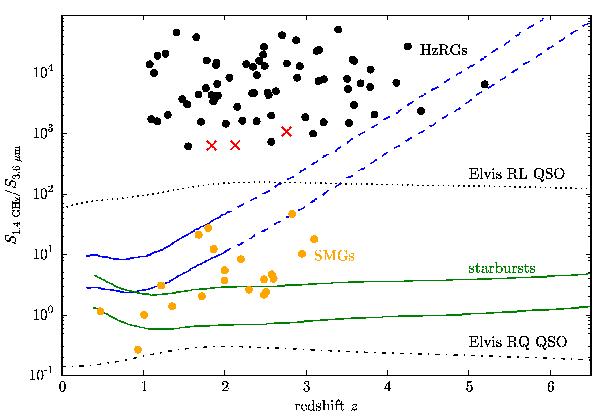
Ratio of 1.4 GHz and 3.6 μm flux densities for IFRS and several other classes of object as a function of redshift, adapted from Norris et al. (2011). It shows that the IFRS analysed in this paper (red crosses) are more similar to HzRGs (black dots, Seymour et al. 2007) than to other types of galaxies frequently found at high redshifts. The solid lines indicate the expected loci of luminous and ultra-luminous infrared galaxies (ULIRGs), using the templates from Rieke et al. (2009). The dotted and dot-dashed lines indicate the loci of a classical radio-loud and radio-quiet QSO, respectively, from Elvis et al. (1994). The location of classical submillimetre galaxies is indicated by the orange dots. We note that dust extinction could cause any of the calculated tracks to rise steeply at high redshift, where the observed 3.6 μm emission is generated in visible wavelengths in the galaxy rest frame. This is illustrated by the dashed lines which show the effect of adding Av = 8m of extinction to the two starburst tracks. However, the radio emission from these galaxies would then be undetectable at z > 2 with current sensitivity.
Current usage metrics show cumulative count of Article Views (full-text article views including HTML views, PDF and ePub downloads, according to the available data) and Abstracts Views on Vision4Press platform.
Data correspond to usage on the plateform after 2015. The current usage metrics is available 48-96 hours after online publication and is updated daily on week days.
Initial download of the metrics may take a while.