Fig. 1
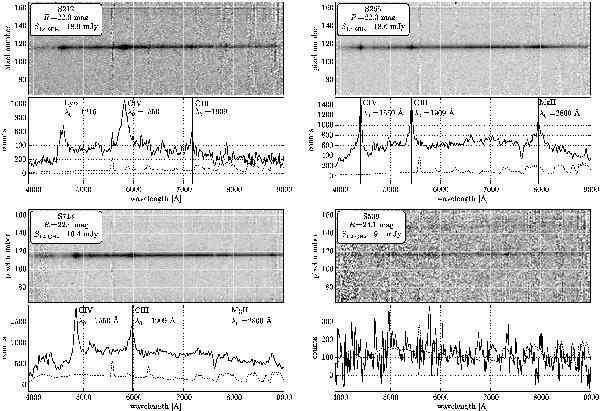
Spectra of IFRS S212 (upper left), S265 (upper right), S713 (lower left), and S539 (lower right). For each IFRS we show the two-dimensional spectrum (upper plot) and the extracted one-dimensional spectrum (lower plot). We list the ID, the R band Vega magnitude, and the 1.4 GHz radio flux density of each IFRS. In the one-dimensional spectrum, the solid line represents the spectrum of the IFRS while the dotted line shows the sky background in arbitrary units. Additionally, the position of emission lines are marked by vertical lines for a redshift of z = 2.76 (S212), z = 1.84 (S265), and z = 2.13 (S713).
Current usage metrics show cumulative count of Article Views (full-text article views including HTML views, PDF and ePub downloads, according to the available data) and Abstracts Views on Vision4Press platform.
Data correspond to usage on the plateform after 2015. The current usage metrics is available 48-96 hours after online publication and is updated daily on week days.
Initial download of the metrics may take a while.