Fig. 4
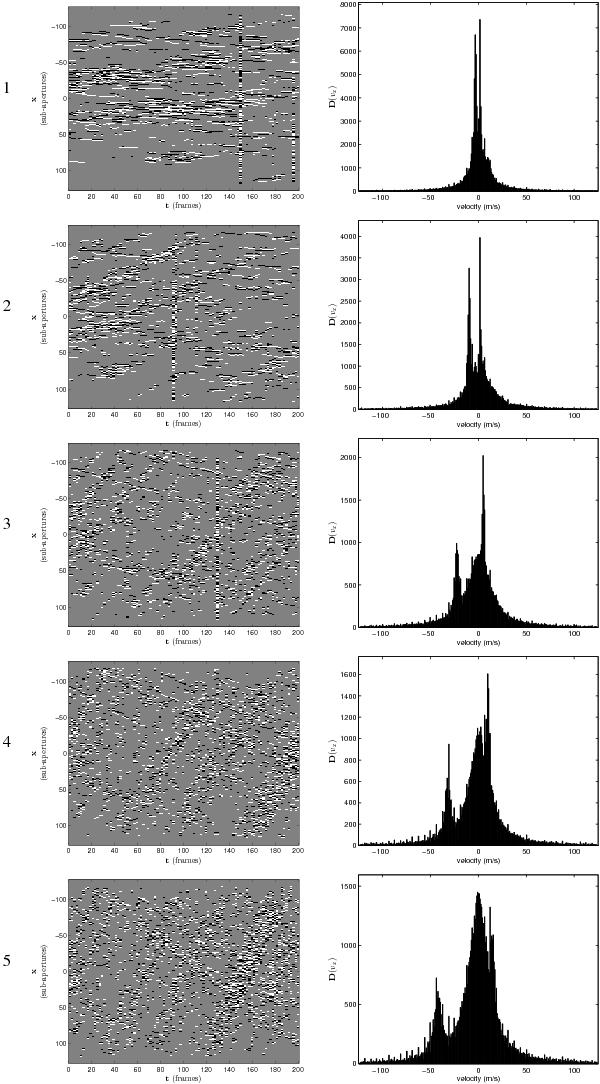
Left column: xt projection of the helicity array. Right column: corresponding velocity distributions, D(vx). Note, the vertical lines seen in projections 1, 2, and 3 to the left are bad frames of wavefront sensor data; they have no significant effect on the peaks of D(vx), demonstrating the robustness of the technique.
Current usage metrics show cumulative count of Article Views (full-text article views including HTML views, PDF and ePub downloads, according to the available data) and Abstracts Views on Vision4Press platform.
Data correspond to usage on the plateform after 2015. The current usage metrics is available 48-96 hours after online publication and is updated daily on week days.
Initial download of the metrics may take a while.