Fig. A.1
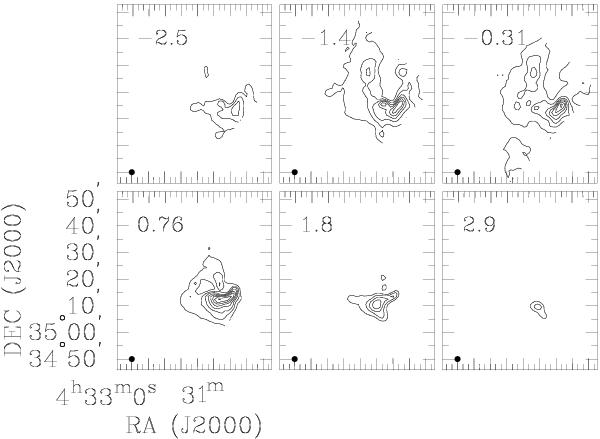
Molecular transition 12CO J = 2−1 channel maps. The center velocities are shown in the upper left corners of each panel in units of km s-1. The integrated velocity interval in each panel is 1.1 km s-1. The contour levels are from 20% up to 90% of the peak with an adjacent contour intervals of 10%. The solid black circle in the lower left corner gives the beam size.
Current usage metrics show cumulative count of Article Views (full-text article views including HTML views, PDF and ePub downloads, according to the available data) and Abstracts Views on Vision4Press platform.
Data correspond to usage on the plateform after 2015. The current usage metrics is available 48-96 hours after online publication and is updated daily on week days.
Initial download of the metrics may take a while.