Fig. 9
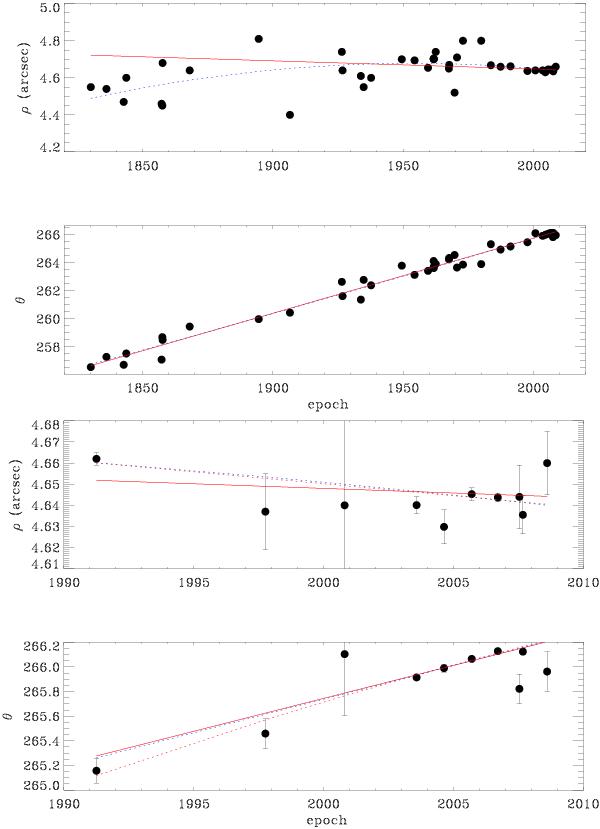
Upper panel: relative astrometry of HD 200466. From top to bottom: projected separation vs. time; position angle (corrected for precession) vs. time; data from WDS (kindly provided by Dr. B. Mason) and from Table 2; linear fits over the whole time extent of observations are shown as solid red lines. Dotted blue lines represent the quadratic fits and dashed green lines the linear fits made separately on data taken before and after 1950.0. The dotted red line is the fit on the recent high-quality measurements, extrapolated backward in time. The lower panel displays the same quantities the first two panels, plotting only the best data (Hipparcos, speckle interferometry, adaptive optics). The dotted red line is the fit on the recent high-quality measurements, the continuous red line the linear fit over all the measurements, the dotted blue line the quadratic fit.
Current usage metrics show cumulative count of Article Views (full-text article views including HTML views, PDF and ePub downloads, according to the available data) and Abstracts Views on Vision4Press platform.
Data correspond to usage on the plateform after 2015. The current usage metrics is available 48-96 hours after online publication and is updated daily on week days.
Initial download of the metrics may take a while.