Fig. 7
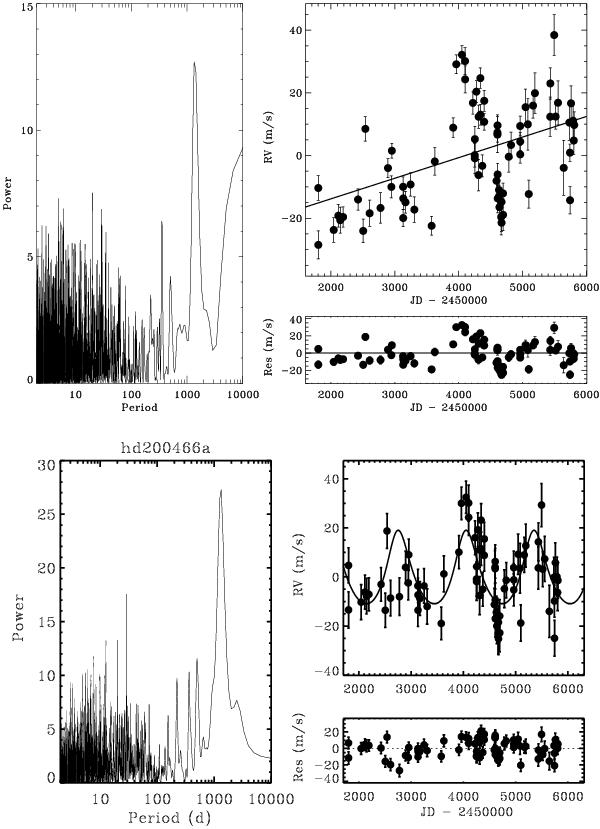
Analysis of RVs for HD 200466A. Upper panels: measured RVs. Left panels: Lomb-Scargle periodogram. Right panels: temporal series of RVs and the residuals from the RV trend predicted by the binary orbital solution. Lower panels: RVs corrected for binary motion. Left panel: Lomb-Scargle periodogram of the residuals. Right panels: RVs of the residuals. Overplotted is the best Keplerian fit of RVs including the RV trend derived from HD 200466B and the residuals (Sect. 6).
Current usage metrics show cumulative count of Article Views (full-text article views including HTML views, PDF and ePub downloads, according to the available data) and Abstracts Views on Vision4Press platform.
Data correspond to usage on the plateform after 2015. The current usage metrics is available 48-96 hours after online publication and is updated daily on week days.
Initial download of the metrics may take a while.