Free Access
Fig. 4
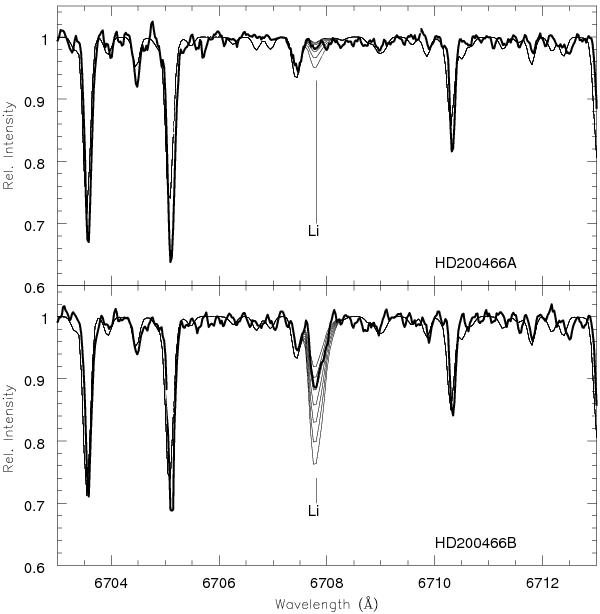
Portion of spectra of HD 200466A (upper panel) and B (lower panel) close to Li 6708Å (thick solid line) overplotted with the synthetic spectra (thin solid lines). They are derived for: log n(Li) = 0.6, 0.8, 1.0, 1.2, 1.4, 1.6, 1.8 for HD 200466A and log n(Li) = 2.0, 2.1, 2.2, 2.3, 2.4, 2.5, 2.6 for HD 200466B.
Current usage metrics show cumulative count of Article Views (full-text article views including HTML views, PDF and ePub downloads, according to the available data) and Abstracts Views on Vision4Press platform.
Data correspond to usage on the plateform after 2015. The current usage metrics is available 48-96 hours after online publication and is updated daily on week days.
Initial download of the metrics may take a while.