Fig. 1
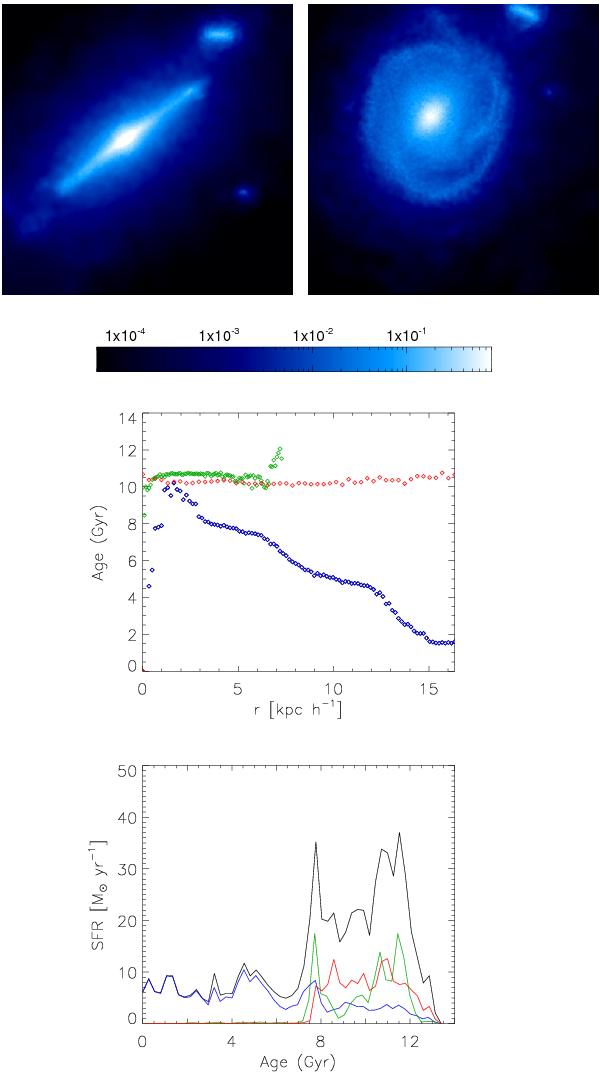
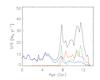
Edge-on and face-on density maps for a typical galaxy of our catalogue (G1 in Table 1) in simulation S230A (upper panels). The color bar shows stellar density in units of 1010 M⊙ kpc-3. The middle and lower panels show the age gradients and star formation rate for stars in the central spheroid (green), the disc (blue), the stellar halo (red). The solid black line in the lower panel correspond to the total star formation rate.

Current usage metrics show cumulative count of Article Views (full-text article views including HTML views, PDF and ePub downloads, according to the available data) and Abstracts Views on Vision4Press platform.
Data correspond to usage on the plateform after 2015. The current usage metrics is available 48-96 hours after online publication and is updated daily on week days.
Initial download of the metrics may take a while.