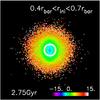
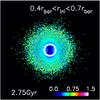
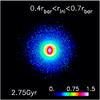
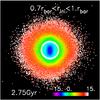
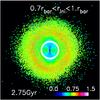
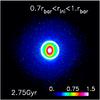
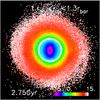
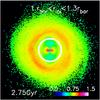
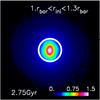
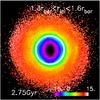
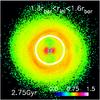
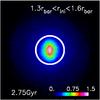
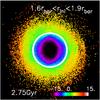
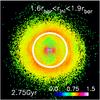
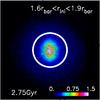
Fig. 5
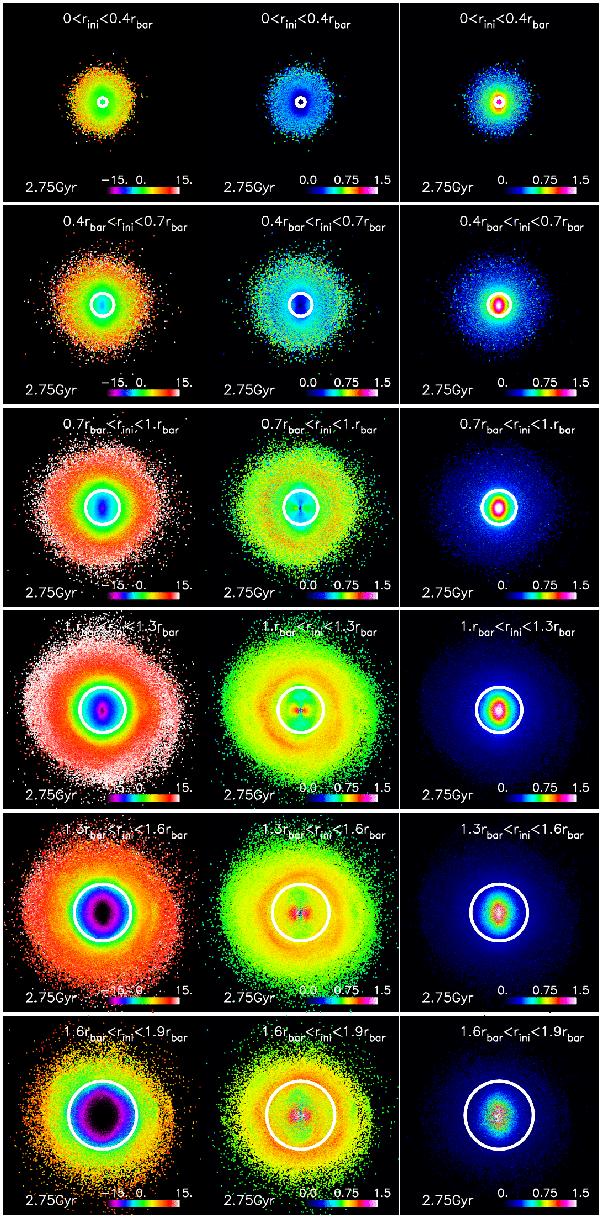
From left to right: face-on maps of the angular momentum variation ΔL, of the rotational support Lnorm = L/Lcirc, and of the vertical velocity dispersion σz for stars with different birth radii (from top to bottom: rini ≤ 0.4rbar; 0.4rbar ≤ rini ≤ 0.7rbar; 0.7rbar ≤ rini ≤ rbar; rbar ≤ rini ≤ 1.3rbar; 1.3rbar ≤ rini ≤ 1.6rbar; 1.6rbar ≤ rini ≤ 1.9rbar). In this, and in all the following maps, all the quantities have been calculated over pixels whose size is 100 pc × 100 pc. The strong AM redistribution following bar formation is evident from the ΔL maps. The rotational support Lnorm shown in the middle column is the ratio between the average L at a given pixel, and the AM, Lcirc, that a star in circular orbit at the same location would have. In each panel, the stellar bar is aligned with the y-axis and the average initial radius is indicated by a white circle. All the plots correspond to the time t = 2.75 Gyr, as indicated. Angular momenta, and their variation, are in units of 100 km s-1 kpc-1; velocities in units of 100 km s-1.
Current usage metrics show cumulative count of Article Views (full-text article views including HTML views, PDF and ePub downloads, according to the available data) and Abstracts Views on Vision4Press platform.
Data correspond to usage on the plateform after 2015. The current usage metrics is available 48-96 hours after online publication and is updated daily on week days.
Initial download of the metrics may take a while.