Fig. 4
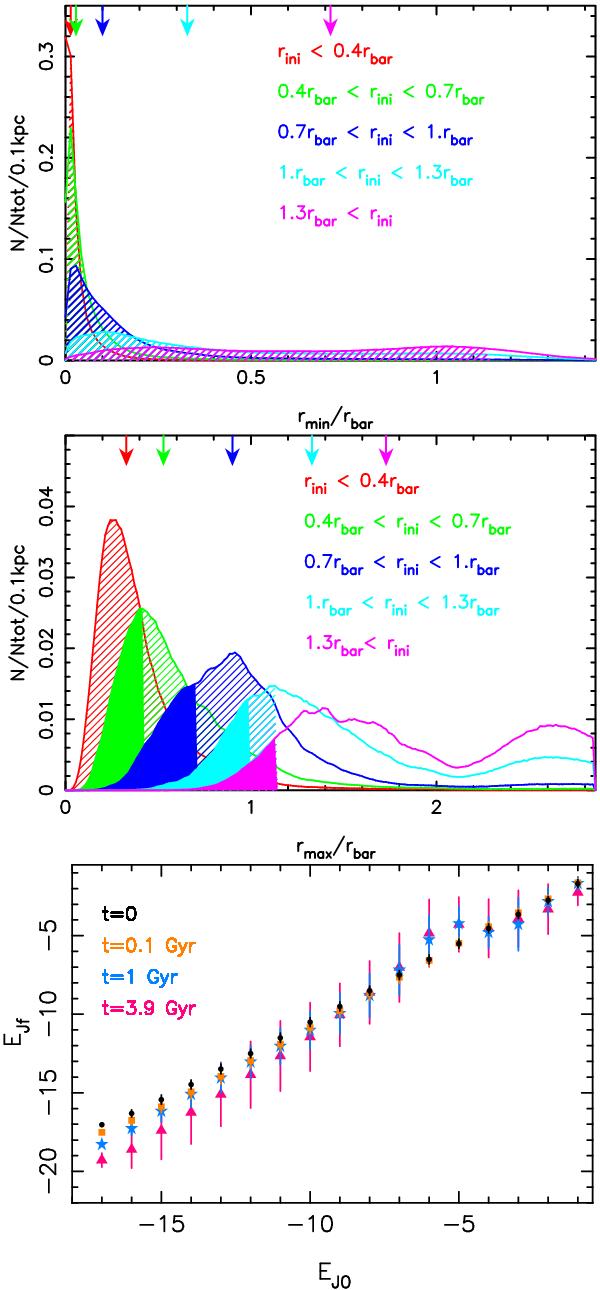
Top panel: distribution of the orbital pericenter radii of stars of different provenance in the disk, as indicated in the legend. The dashed area represents stars whose pericenter radii are inside the bar region. The arrows on the top axis indicate the medians of the five distributions. Middle panel: same as the top panel, but for the distribution of orbital apocenter radii. The dashed area represents stars whose apocenter radii are inside the bar region, the full area stars whose apocenter radii are also smaller than their birth radii. Distances are in units of the initial bar scale length, rbar. Bottom panel: temporal evolution of Jacoby energy in a rotating frame with pattern speed Ω = 25km s-1 kpc-1. For each bin in the initial Jacoby energy EJ0, the corresponding value EJf at time t is plotted, together with the standard deviation of the distribution. Different colors correspond to different times during the evolution of the disk: initial time (black); axisymmetric stellar distribution (orange); epoch of strong thin stellar bar before buckling (blue); final configuration, after the formation of the boxy bulge (red).
Current usage metrics show cumulative count of Article Views (full-text article views including HTML views, PDF and ePub downloads, according to the available data) and Abstracts Views on Vision4Press platform.
Data correspond to usage on the plateform after 2015. The current usage metrics is available 48-96 hours after online publication and is updated daily on week days.
Initial download of the metrics may take a while.