Fig. 1
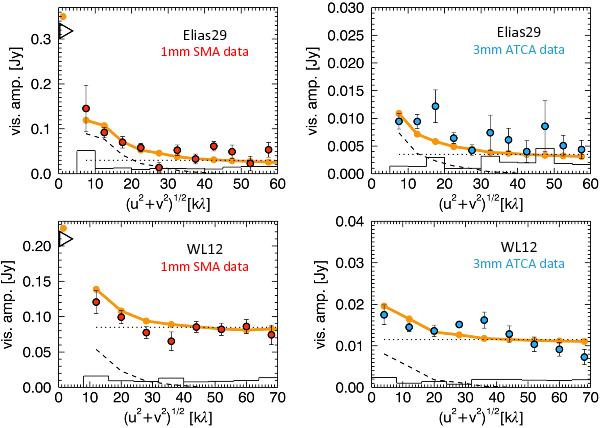
Visibility amplitudes expressed in jansky against the u–v distances in kλ.The data points give the amplitudes per bin. The data are binned in annuli according to u–v distance. In the top panels we present the amplitudes of Elias29: in the left panel, the archival 1.1 mm SMA dataset (Jørgensen et al. 2009), and in the right panel the new 3 mm ATCA dataset. In the bottom panels we plot the same for WL12. The histograms give the expected amplitudes for zero signal. The open triangles at zero u–v distance give the zero spacing 1.1 mm fluxes, interpolated between 850 μm and 1.25 mm single-dish fluxes (Lommen et al. 2008; Jørgensen et al. 2009). The orange lines are the best fits of the observed emission, obtained using a combination of a two-layer disk model (Chiang & Goldreich 1997; Dullemond et al. 2001) surrounded by a power-law density envelope. We used the Monte Carlo radiative transport model RADMC-3D (Dullemond & Dominik 2004) to compute the emission from the envelope. The separate contributions given by the disk and the envelope are plotted with the dotted and dashed lines, respectively
Current usage metrics show cumulative count of Article Views (full-text article views including HTML views, PDF and ePub downloads, according to the available data) and Abstracts Views on Vision4Press platform.
Data correspond to usage on the plateform after 2015. The current usage metrics is available 48-96 hours after online publication and is updated daily on week days.
Initial download of the metrics may take a while.