Free Access
Fig. 8
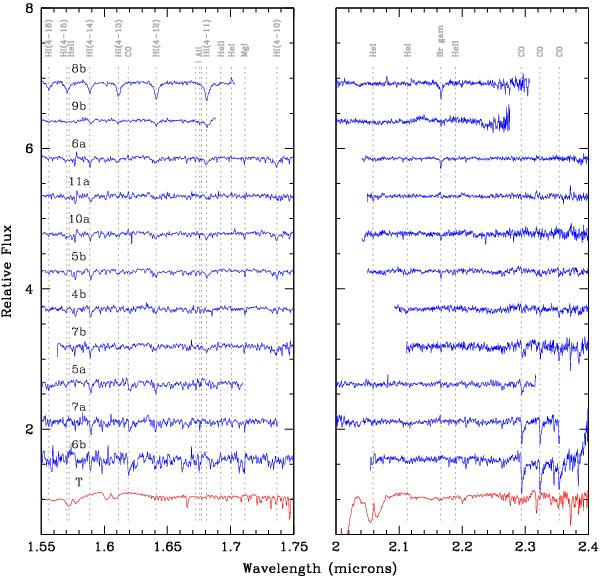
Individual spectra in H (left) and K band (right) for the AFG-type dwarfs and the giant stars. We show in grey the spectral lines used for the spectral classification. The red spectrum corresponds to the telluric correction spectrum, shown for spectral feature comparison.
Current usage metrics show cumulative count of Article Views (full-text article views including HTML views, PDF and ePub downloads, according to the available data) and Abstracts Views on Vision4Press platform.
Data correspond to usage on the plateform after 2015. The current usage metrics is available 48-96 hours after online publication and is updated daily on week days.
Initial download of the metrics may take a while.