Fig. 5
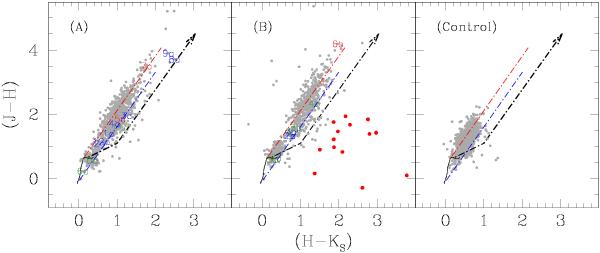
Cluster CCDs for regions A (left), B (middle), and the control field (right). We use the same symbols as in Fig. 4 to mark the spectroscopically observed stars. In the diagrams we mark with segmented lines the position of an O8 V (blue lines) and a K5 V star (red lines), following the Rieke extinction law (Rieke et al. 1989), as used in this work. Thicker black segmented lines show the expected position for T Tauri stars along the extinction vector. In the region B diagram, we show with red circles the stars with infrared excess, candidates to Herbig Ae/Be objects.
Current usage metrics show cumulative count of Article Views (full-text article views including HTML views, PDF and ePub downloads, according to the available data) and Abstracts Views on Vision4Press platform.
Data correspond to usage on the plateform after 2015. The current usage metrics is available 48-96 hours after online publication and is updated daily on week days.
Initial download of the metrics may take a while.