Free Access
Fig. 10
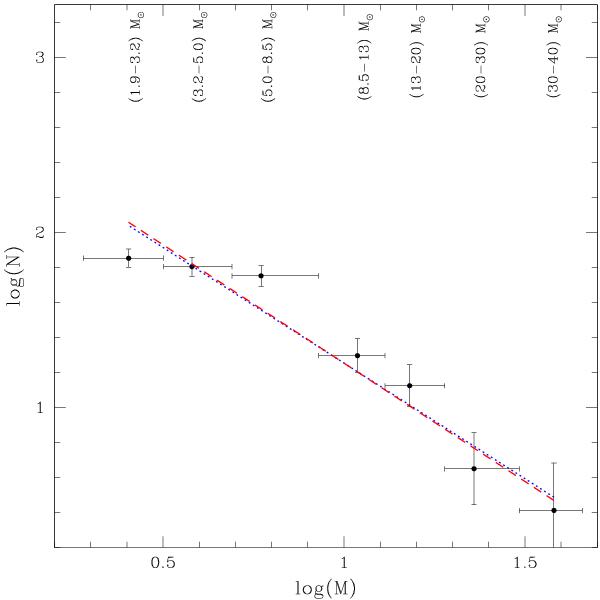
Present-day mass function for Masgomas-4. Points show the central position in the mass ranges indicated above them, and the segmented red line corresponds to the Kroupa IMF fitted to the data. As a comparison, we show the least-squares fitting (one degree function) to our data with a blue dotted line.
Current usage metrics show cumulative count of Article Views (full-text article views including HTML views, PDF and ePub downloads, according to the available data) and Abstracts Views on Vision4Press platform.
Data correspond to usage on the plateform after 2015. The current usage metrics is available 48-96 hours after online publication and is updated daily on week days.
Initial download of the metrics may take a while.