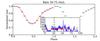
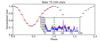
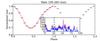
Fig. 7
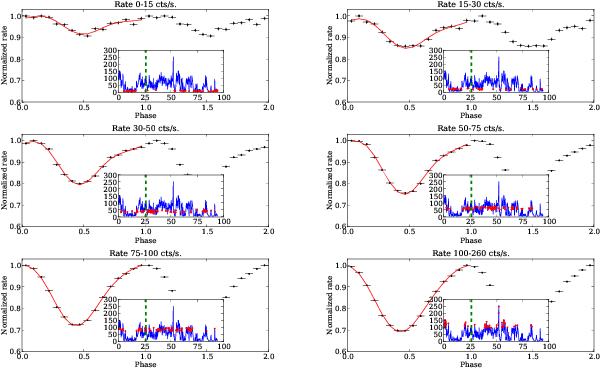
Pulse profiles of the combined obs1 and obs2 extracted during the different count-rate intervals of the blue states as in Table 3. In all panels of this figure, count rates were normalised to the maximum. Pulses are repeated twice for clarity and the red solid lines represent the best fits to the profiles with two sinusoidal functions as described in the text. The insets in each panel show the lightcurves of the two observations in the 0.5–11 keV energy range (as in Fig. 1) with the time intervals used to extract the pulse profiles highlighted in red.
Current usage metrics show cumulative count of Article Views (full-text article views including HTML views, PDF and ePub downloads, according to the available data) and Abstracts Views on Vision4Press platform.
Data correspond to usage on the plateform after 2015. The current usage metrics is available 48-96 hours after online publication and is updated daily on week days.
Initial download of the metrics may take a while.