Fig. 4
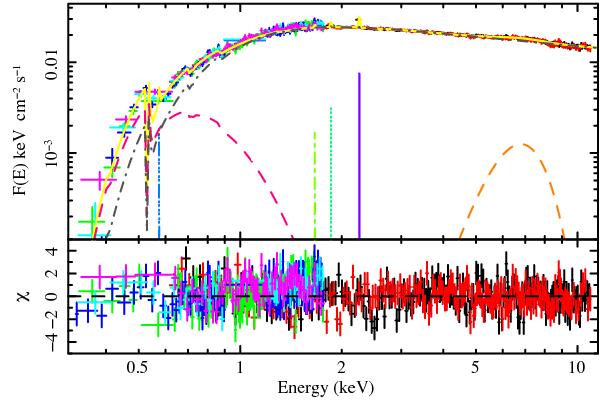
Average unfolded spectra of IGR J18245–2452 in obs1 and obs2. Colors refer to the different observations and instruments (red: EPIC-pn obs1; black: EPIC-pn obs2; green: RGS1 obs2; blue: RGS2 obs2; light blue: RGS1 obs1; magenta: RGS2 obs1). The best-fit model is reported in Table 2. We show in the lower panel the residuals from the best fit (see text for details).
Current usage metrics show cumulative count of Article Views (full-text article views including HTML views, PDF and ePub downloads, according to the available data) and Abstracts Views on Vision4Press platform.
Data correspond to usage on the plateform after 2015. The current usage metrics is available 48-96 hours after online publication and is updated daily on week days.
Initial download of the metrics may take a while.