Fig. 2
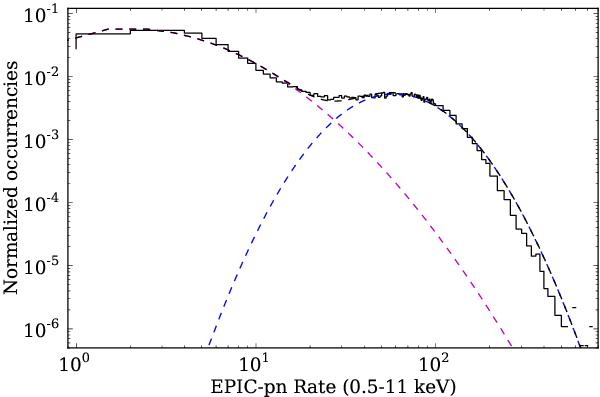
Histogram of the count-rate derived from the combined lightcurves of the two observations (energy range 0.5–11 keV, time bin 1 s). The black solid line represents the total source count-rate. The black dashed line is the sum of two best-fit log-normal distributions, plotted in blue and magenta.
Current usage metrics show cumulative count of Article Views (full-text article views including HTML views, PDF and ePub downloads, according to the available data) and Abstracts Views on Vision4Press platform.
Data correspond to usage on the plateform after 2015. The current usage metrics is available 48-96 hours after online publication and is updated daily on week days.
Initial download of the metrics may take a while.