Fig. 12
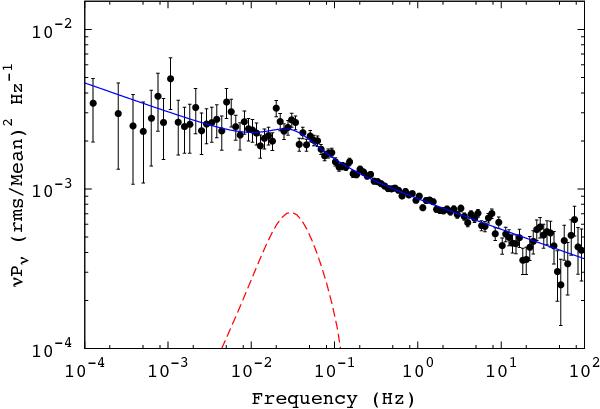
Power spectral density observed during obs2. The power spectrum was rebinned geometrically using a factor of 1.30, and subtracted of a white noise level of 1.9948(5). The model used to fit the spectrum (red solid line) is the sum of a flicker noise component (Eq. (2)) and a Lorentzian (red dashed line).
Current usage metrics show cumulative count of Article Views (full-text article views including HTML views, PDF and ePub downloads, according to the available data) and Abstracts Views on Vision4Press platform.
Data correspond to usage on the plateform after 2015. The current usage metrics is available 48-96 hours after online publication and is updated daily on week days.
Initial download of the metrics may take a while.