Fig. 11
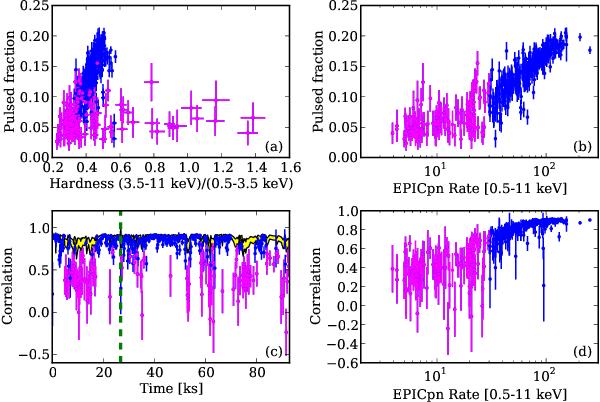
Timing analysis performed for every time bin with length of at least of 200 s and S/N ≥ 25 in obs1 and obs2. The origin of times is the same as specified in Fig. 1. Panel a): pulsed fraction as a function of the HR. Panel b): pulsed fraction as a function of the source total intensity. Panel c): linear correlation coefficient between the average pulse profile and the pulse profile computed in each time bin (the shaded yellow area represents the expected range of correlation values at 1σ c.l. that all profiles should have if no changes occur other than the average one; the level of timing noise of the observation was also taken into account). Panel d): the correlation coefficient as function of the source count rate. The uncertainties are reported at 1σ c.l. and are computed for the pulsed fraction and correlation coefficient using a bootstrapping technique with 1000 realizations.
Current usage metrics show cumulative count of Article Views (full-text article views including HTML views, PDF and ePub downloads, according to the available data) and Abstracts Views on Vision4Press platform.
Data correspond to usage on the plateform after 2015. The current usage metrics is available 48-96 hours after online publication and is updated daily on week days.
Initial download of the metrics may take a while.