Fig. 1
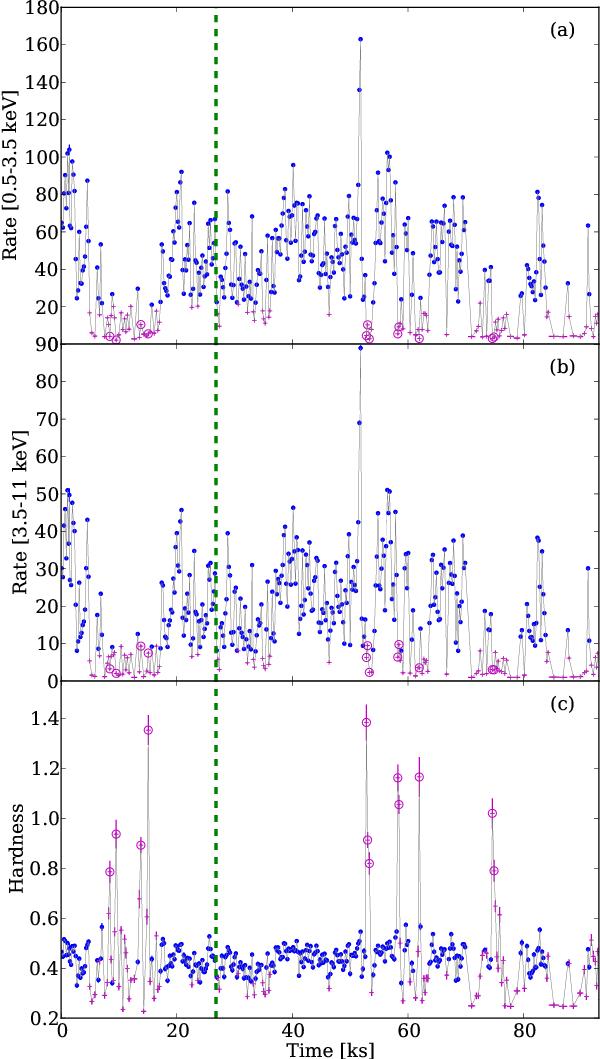
Top panel: XMM-Newton lightcurve of IGR J18245–2452 extracted from obs1 and obs2 in the 0.5–3.5 keV energy band. The vertical dashed line represents the separation between the two observations. Times of obs1 are measured starting from 00:25:22 on 2013 April 04 (TBD). For the second observation the start time is 2013 April 13 at 07:03:06 (TBD; note that times have been shifted by 26.3 ks for plotting purposes). Middle panel: same as before, but in the 3.5–11 keV energy range. This lightcurve was adaptively rebinned to achieve a signal-to-noise (S/N) ratio of 25 in each time bin, while the minimum bins size was set to 200 s (the same binning has been used for the lightcurve in the soft energy band). Bottom panel: hardness ratio (HR) calculated as the ratio of the hard and soft lightcurves. We plot with magenta symbols the time intervals in which the source count rate was lower than 30 cts/s, all the others are given in blue. The points with HR > 0.7 are highlighted with an open circle.
Current usage metrics show cumulative count of Article Views (full-text article views including HTML views, PDF and ePub downloads, according to the available data) and Abstracts Views on Vision4Press platform.
Data correspond to usage on the plateform after 2015. The current usage metrics is available 48-96 hours after online publication and is updated daily on week days.
Initial download of the metrics may take a while.