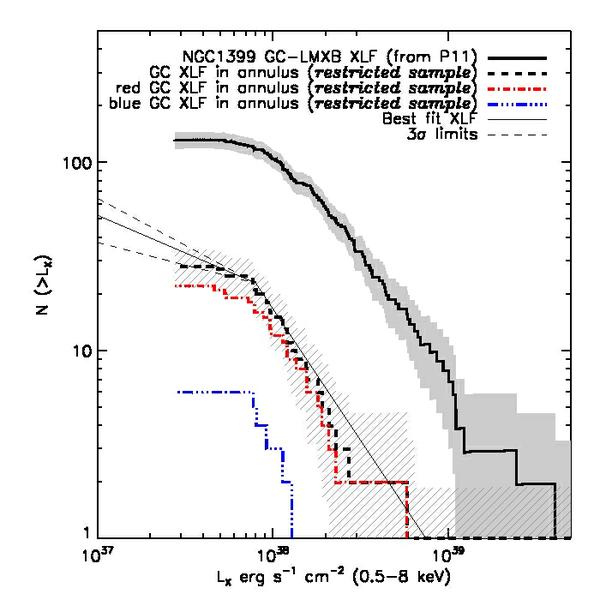
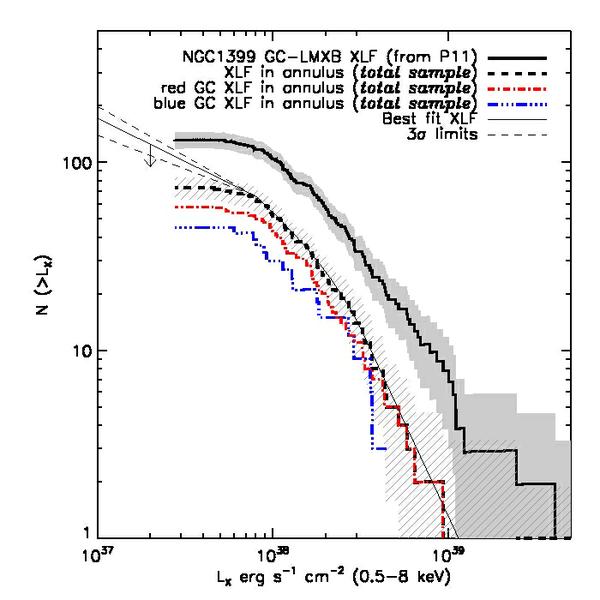
Fig. 3
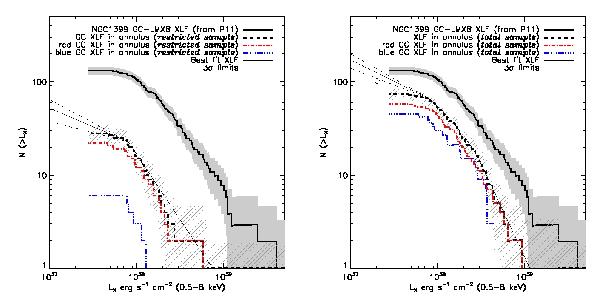
Left panel: cumulative XLF for all, red, and blue (individually detected) GCs-LMXB within the 120″ − 180″ annulus (restricted sample). For comparison the thick solid line represents the total XLF in NGC 1399, as derived in P11. The statistical uncertainties are shown, for the total NGC 1399 and annular XLF, as shaded (solid and dashed) areas. For clarity, the best-fit analytical XLF (according to Eq. (5)), is shown only for the total GCs-LMXB annular sample as a thin solid line, while its upper and lower 3σ limits (Table 3) are marked by dashed lines. Right panel: as left panel for the total sample. The downward arrow emphasizes that in this case the faint-end slope has to be considered a conservative limit (see discussion in the text).
Current usage metrics show cumulative count of Article Views (full-text article views including HTML views, PDF and ePub downloads, according to the available data) and Abstracts Views on Vision4Press platform.
Data correspond to usage on the plateform after 2015. The current usage metrics is available 48-96 hours after online publication and is updated daily on week days.
Initial download of the metrics may take a while.