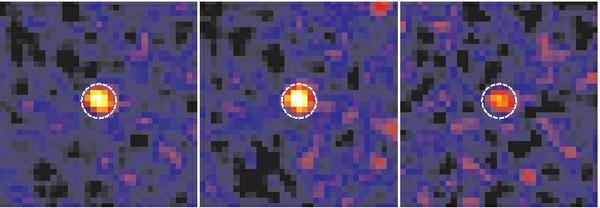
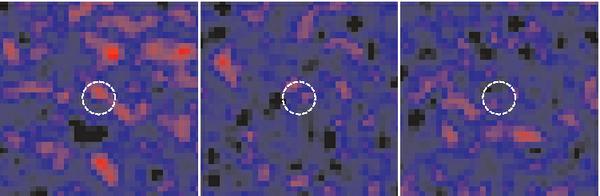
Fig. 2
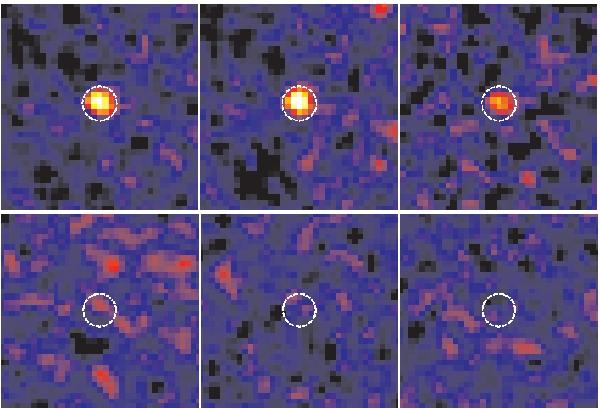
Upper row: stacked images of all GCs subsamples: left) all 618 GCs; center) 316 red GCs; right) 302 blue GCs. The central circle highlights the 3′′diameter region where most of the flux from the stacked LMXBs is concentrated. The images are produced through a sigma-clipped averaging algorithm with the clipping threshold set at 4σ. Lower row: same as the upper row, for 3 of the 100 samples simulated using random positions near real GCs (see discussion in text).
Current usage metrics show cumulative count of Article Views (full-text article views including HTML views, PDF and ePub downloads, according to the available data) and Abstracts Views on Vision4Press platform.
Data correspond to usage on the plateform after 2015. The current usage metrics is available 48-96 hours after online publication and is updated daily on week days.
Initial download of the metrics may take a while.